Everything your user needs in one place.
This page gives the full feature story: what the platform does, what users see on screen, and how each tool helps with day-to-day decision making.
Built for better decisions. Not more trades.
Every feature here exists to help you think more clearly — not to push you into acting faster. Good research slows you down in the right places.
Three models. One verdict.
XGBoost, LSTM, and Random Forest each analyse your ticker independently, then vote. When they agree, confidence is high. When they split — you'll know that too.
Confidence score on every output
Not just BULLISH or CAUTIOUS — you see how strongly the models agree. A 40% score is worth knowing. It tells you to pause, not act on impulse.
Fresh every market day
Yesterday's data is already stale. Models re-run overnight after close — so what you see at 8am reflects last night's actual market activity, not a week-old snapshot.
Your watchlist. Your focus.
You're not here to scroll through 500 random tickers. Add what you follow, ignore the rest. The platform organises by market and surfaces changes that matter to you.
Morning market overview
Top movers, strongest signals, notable shifts — across all four markets in one view. The first five minutes of your research day, done properly.
Ask the AI anything
Not sure what the output means? Ask. The AI chat knows your watchlist, your signals, and the current market context — and explains it in plain English, not jargon.
Track record. Visible.
See how past model outputs compared to what actually happened. No cherry-picking. The history is there — read it before you decide how much weight to give the signal.
No black box. Ever.
Every output shows which models agreed, which diverged, and what indicators fired. You're not trusting a score blindly — you can see exactly what drove it.
What you actually see when you log in.
Four core views. Each one built around a specific research question users ask every morning.
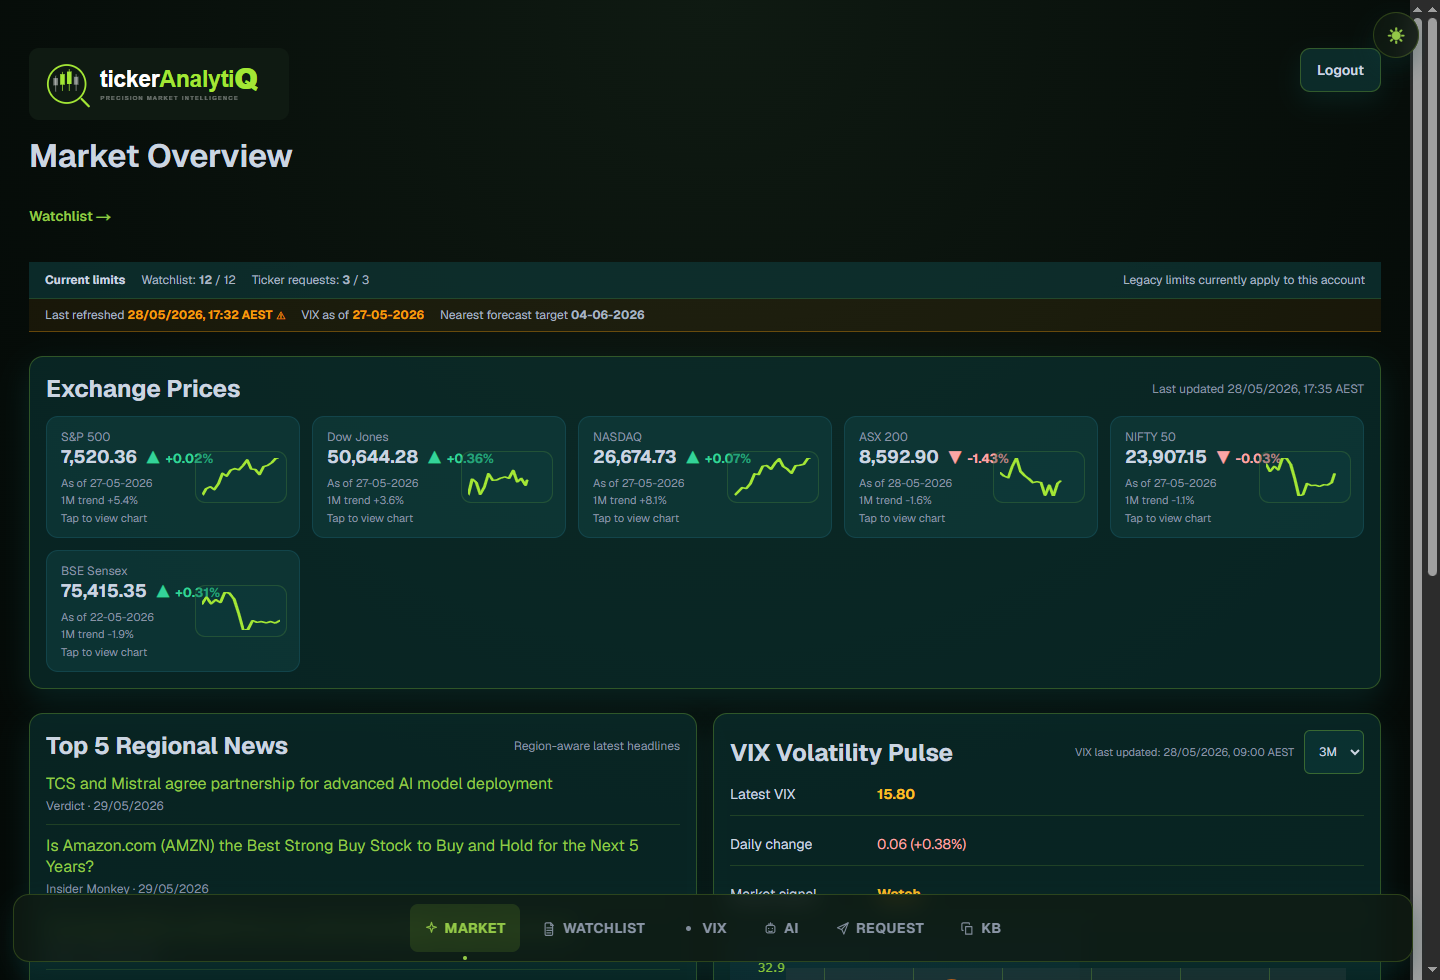
Market Dashboard
Open tickerAnalytiQ each morning and see what moved overnight. Top movers, market context, and volatility shifts across all four markets in one clean view.
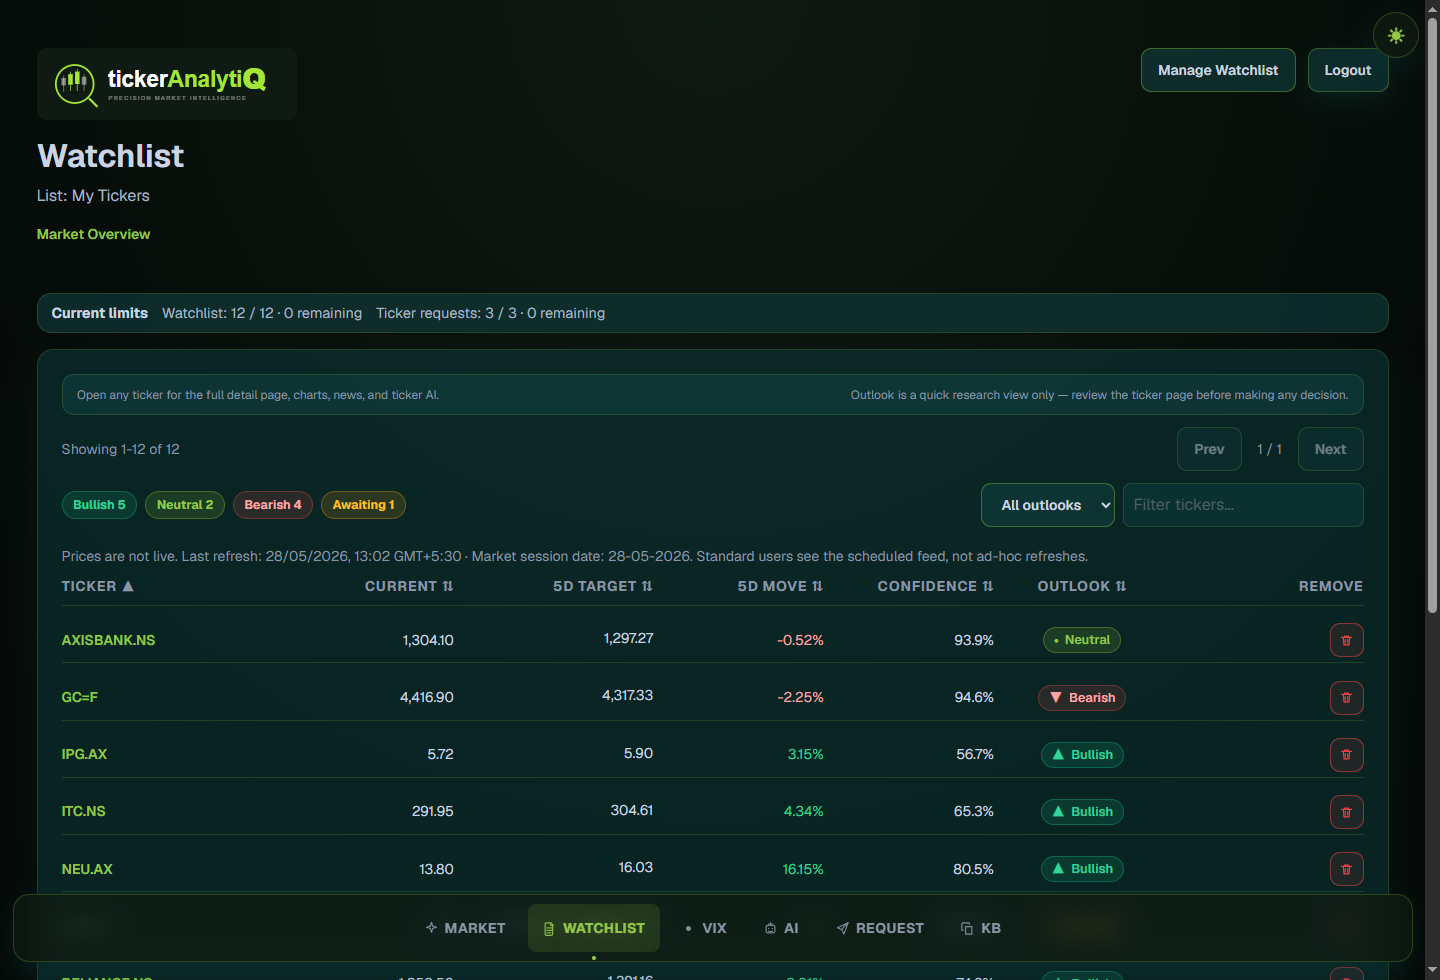
Watchlist with AI Research Views
Track only the names you follow. Each ticker shows the current model classification, confidence score, and a projected move so you can review the research in one place.
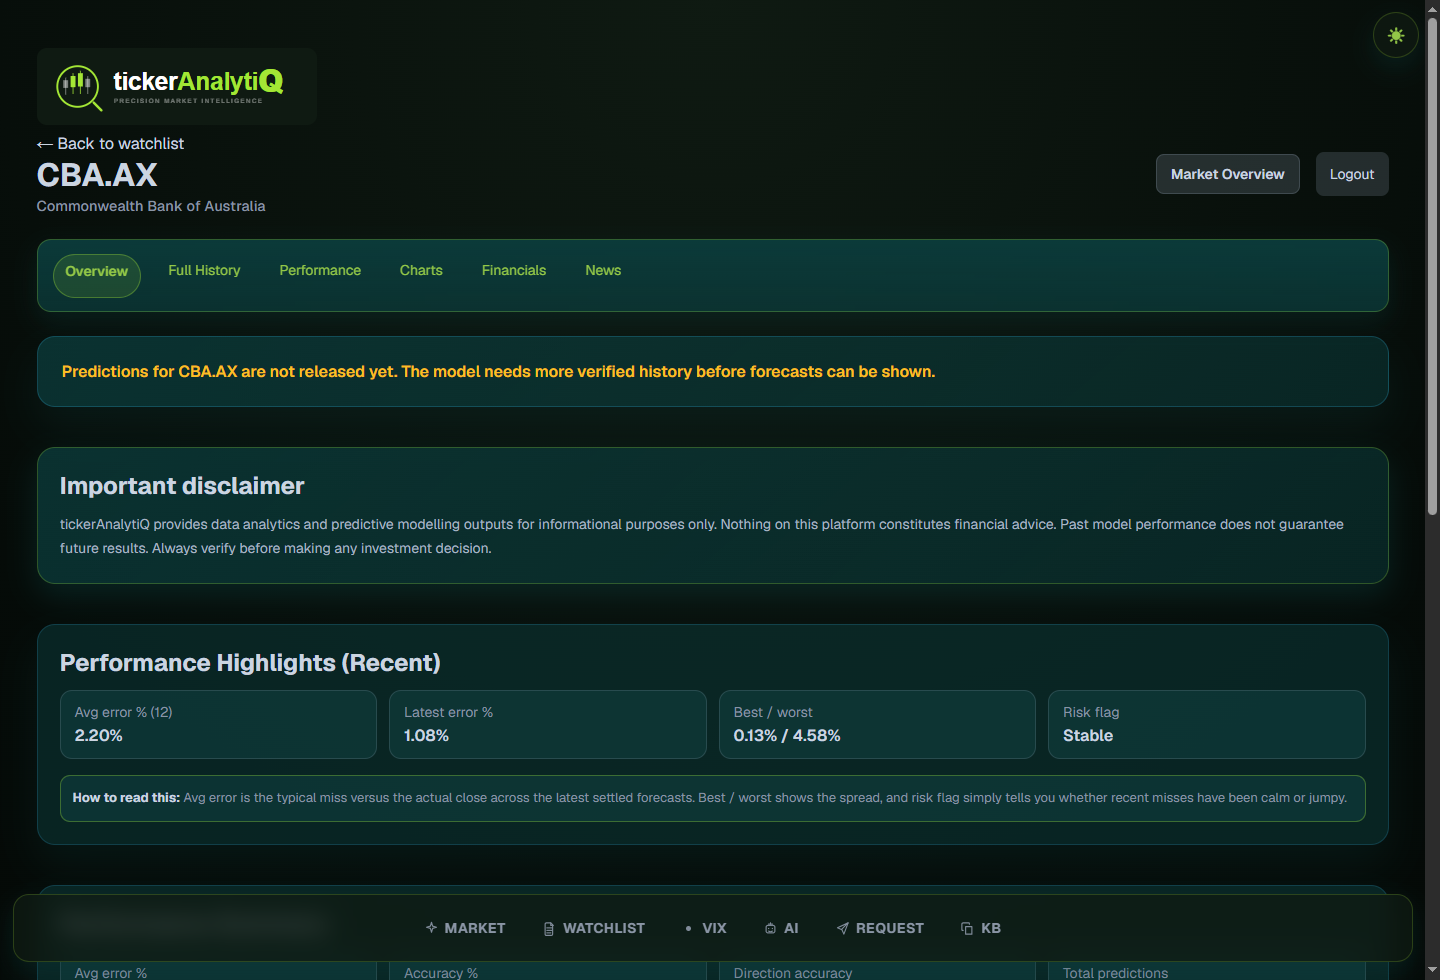
Full Ticker Breakdown
Drill into any stock. Forecast tables, technical charts, model-by-model breakdowns, price history, and performance context sit together so you can inspect the research in detail.
Technical Chart Workspace
Switch to Charts for the technical read. Candles, overlays, RSI and momentum context sit together in one focused workspace so you can pressure-test the model output inside your research workflow.
View plans and limits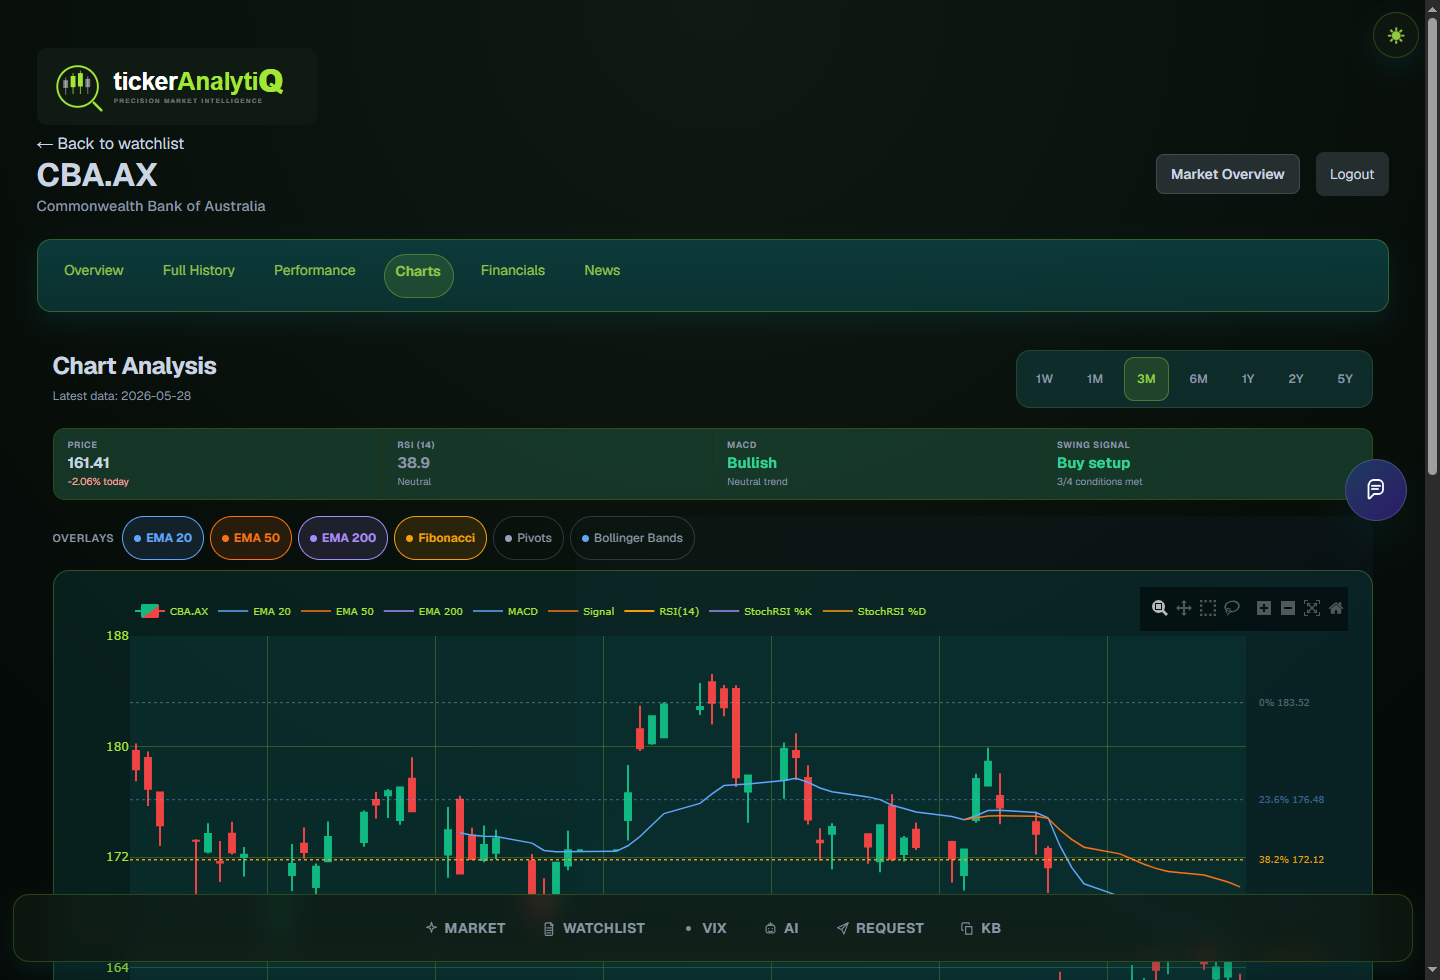
Know what the data says before you decide.
Build your watchlist. Check your morning signals. Ask the AI the hard questions. Then make your own call — informed, not reactive.